Publication: Public sector gender pay gap reporting
by Audit Scotland, Accounts Commission
Public sector gender pay gap reporting
Audit Scotland and the Accounts Commission

Summary report
What is the gender pay gap?
The gender pay gap is the difference between the average hourly rates of pay of men and women expressed as a percentage where a positive figure indicates that women are paid less than men. The gender pay gap is different from equal pay, which is a direct comparison of two people or groups carrying out the same or an equivalent role.
In 2021, the mean gender pay gap in Scotland when comparing overall average hourly earnings was 10.1% (Close the Gap analysis). This means for every £1 men earn women earn £0.90. See key terms explained below.
Why is gender pay gap reporting important?
Gender pay gap reporting helps us understand how men and women’s pay and experiences in the labour market differ, such as women being concentrated into lower paid, part-time work or into different types and levels of work. Accurate gender pay gap reporting underpinned by comprehensive analysis gives an organisation an understanding of how it is performing in terms of gender equality. It helps to inform actions to reduce pay gaps, improve progression and succession planning, and identify gaps or inequalities in recruitment processes. This plays an important role in how public bodies mainstream equality.
It is important for public bodies to share and learn from good practice. Availability of good data and robust analysis allows organisations to strengthen policy making to reduce barriers, enabling fairer, more diverse and inclusive workplaces. This in turn will support the attraction and retention of talent and improvements to organisational performance.
What information should public bodies be reporting?
Since 2013, listed public bodies in Scotland have been subject to a duty to publish gender pay gap information under the Equality Act 2010 (Specific Duties) (Scotland) Regulations 2012. Since March 2016, this duty applies to public bodies with 20 or more staff (previously it applied to public bodies with 150 or more staff).
Listed public bodies must publish information every two years on the percentage difference, among all their employees, between men’s average hourly pay (excluding overtime) and women’s average hourly pay (excluding overtime).
The legislation and the Equalities and Human Rights Commission (EHRC) technical guidance do not set out standardised methodology. However, they do state that the information should be produced as one set of comparative figures for the whole workforce and all staff, including part-time and temporary employees.
Close the Gap has produced non-statutory guidance for reporting on gender and employment, equal pay, and occupational segregation. It clearly sets out how to calculate the gender pay gap and good practice on reporting. It states that it is helpful to publish both mean and median figures as well as other measures to break down the pay gap at different levels. This includes staff grades, full-time and part-time workers, giving a deeper understanding of any pay gaps and where public bodies should direct improvement activities.
 Common pitfalls with gender pay gap reporting include the following:
- excluding the pay of staff in the most senior grades, or staff on fixed-term contracts when calculating the gender pay gap figure
- publishing a full-time pay gap figure only
- publishing a pay gap figure by grade, but no overall figure
- errors in calculations
- publishing a pay gap figure with no accompanying narrative to contextualise the data
- not showing analysis of the figures to support improvement activities.
Why did we do the work and what did we do?
Through our annual audit work, we found issues with some public bodies’ gender pay gap reporting. This included publishing separate figures for different staff groups rather than one overall figure. In addition, Close the Gap and EHRC have found that public sector reporting was inconsistent, and few public bodies set out measurable performance targets in relation to the gender pay gap.
To build on these findings, we reviewed published gender pay gap information from a random sample of 20 listed public bodies. Our sample included a wide range of size and type of organisations across local government, central government, further education and the NHS. We looked at the most recent gender pay gap information, taken from the latest published gender pay gap report or in some instances it was contained in other publications such as the equal pay statement, public sector equality duty report or equality mainstreaming reports. We looked at evidence of good practice and where public bodies have used data to support improvement and reduce the gender pay gap. We didn’t look at the methodologies they had used to calculate it.
 Our analysis looked at whether:
- the overall mean pay gap figure was published (staff at all grades, including full and part-time employees and employees on permanent and fixed-term contracts)
- a median pay gap figure was published alongside the mean
- the pay gap was broken down at different levels, for example by grade and job type (occupational segregation)
- any intersectional data was provided (combining gender data with data for one or more of the other protected characteristics)
- there were accompanying narratives or analysis conducted by public bodies to identify underlying reasons for their pay gap
- any improvement actions were identified to address the gender pay gap.
Key terms explained
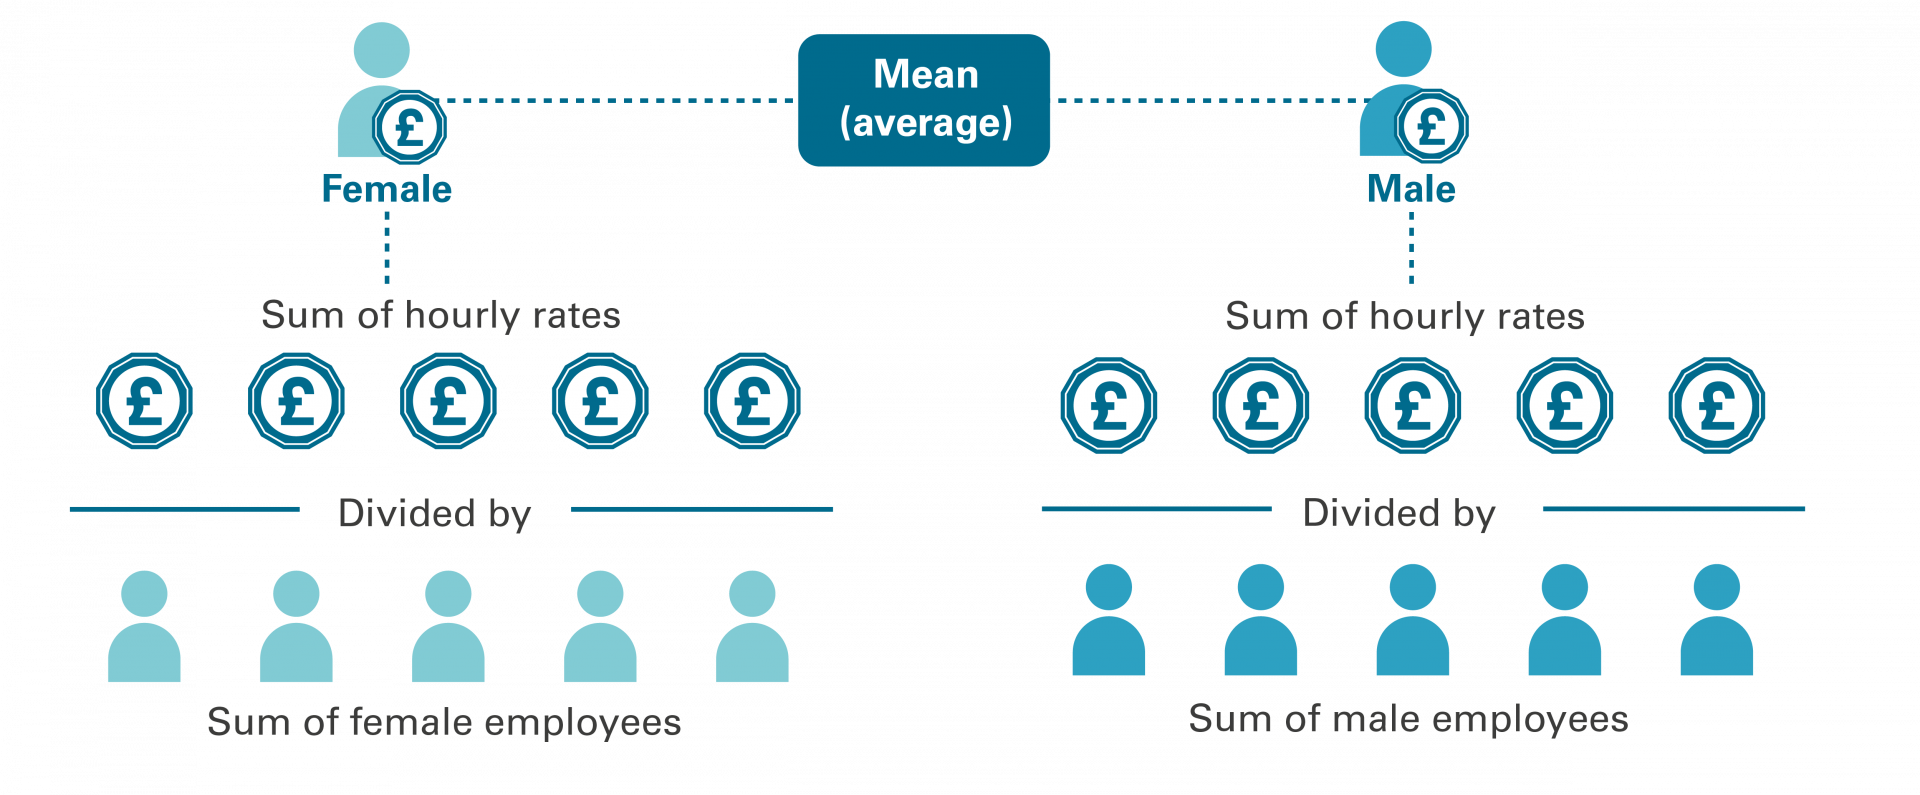
The mean, also known as the average, is where all the numbers are added up and then divided by the number of numbers in the list. The mean will therefore include the lowest and highest rates of pay giving a good overall indication of the gender pay gap.
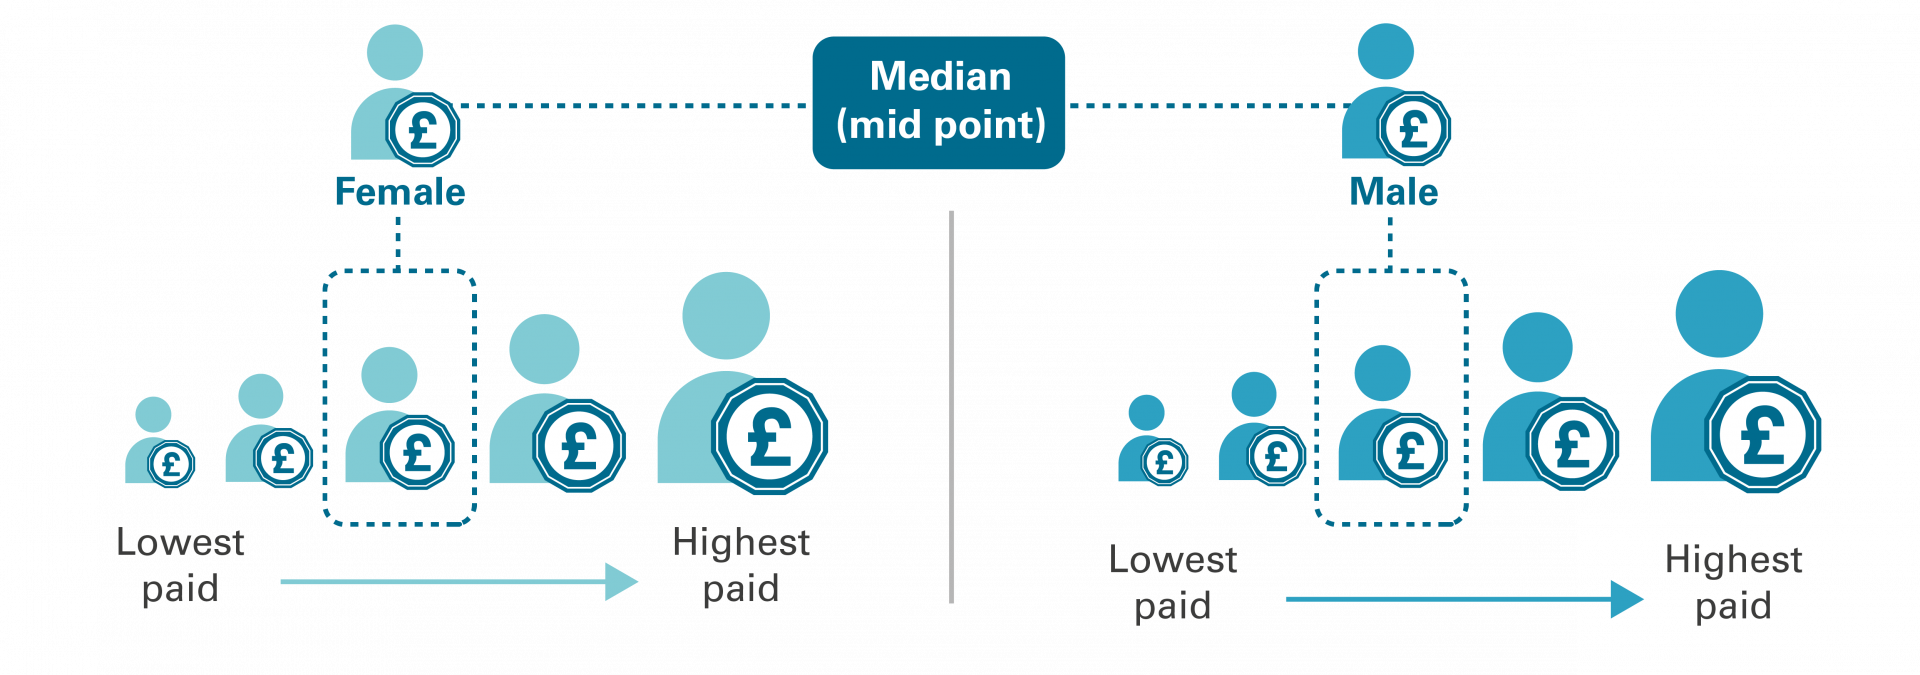
The median is the middle value in the list of numbers. To find the median, data is listed in numerical order. If there is an odd number of results, the median is the middle number, if there is an even number of results, the median will be the average of the two central numbers. The median is not skewed by very high or very low numbers.
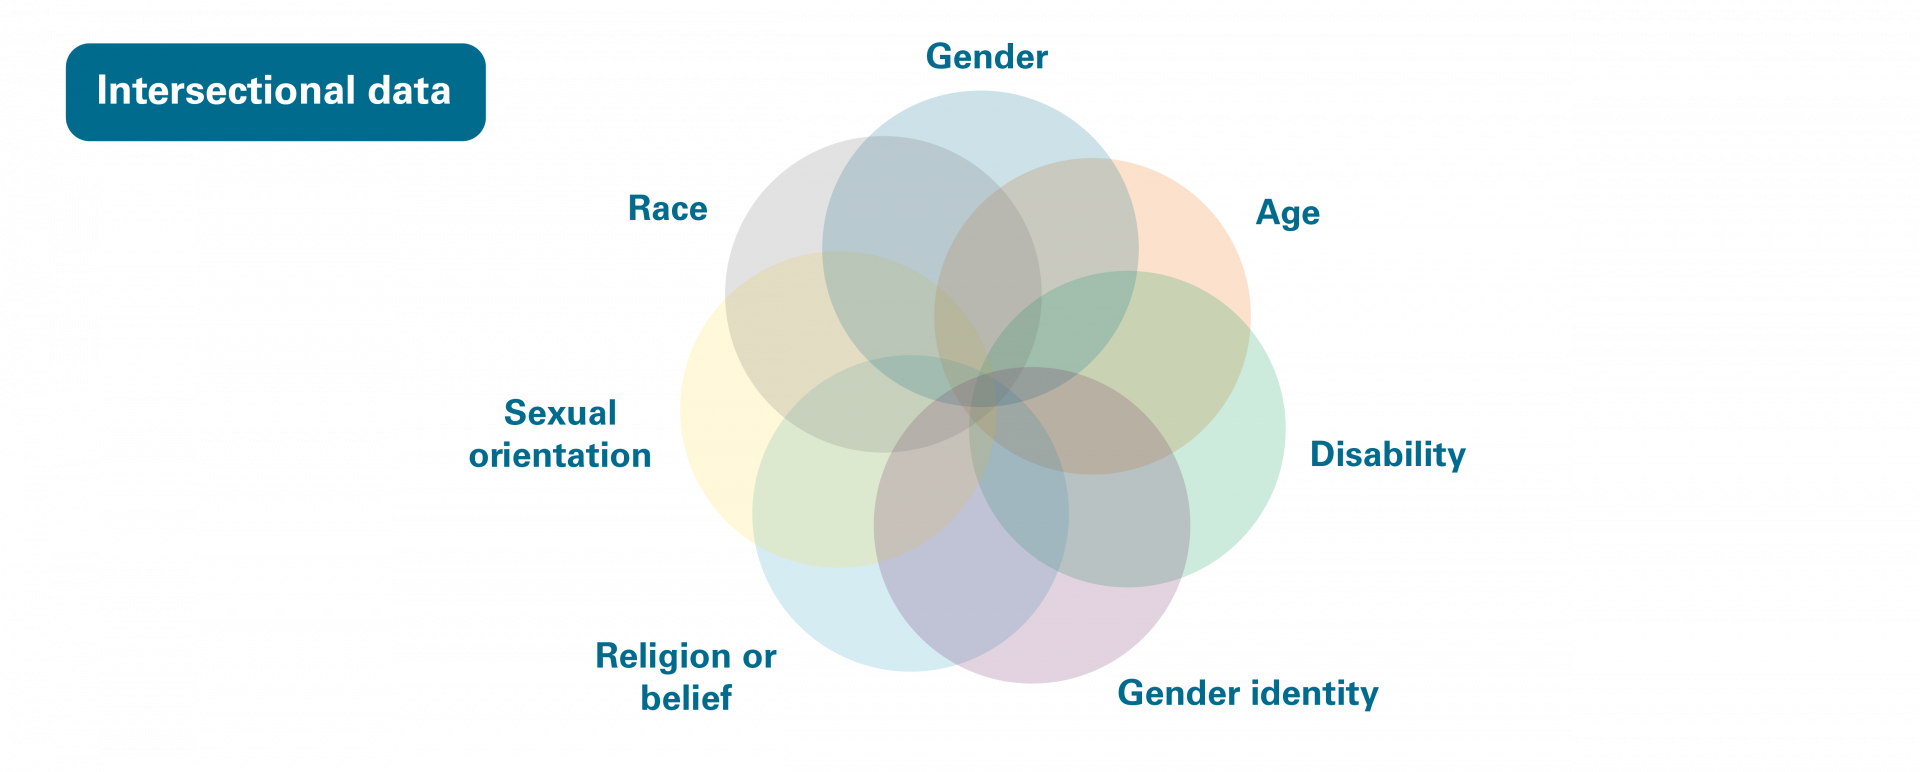
Intersectional data combines data such as gender data with data for other protected characteristics. It can help us to understand the way in which different types of discrimination are connected to and affect each other creating different levels of inequality.
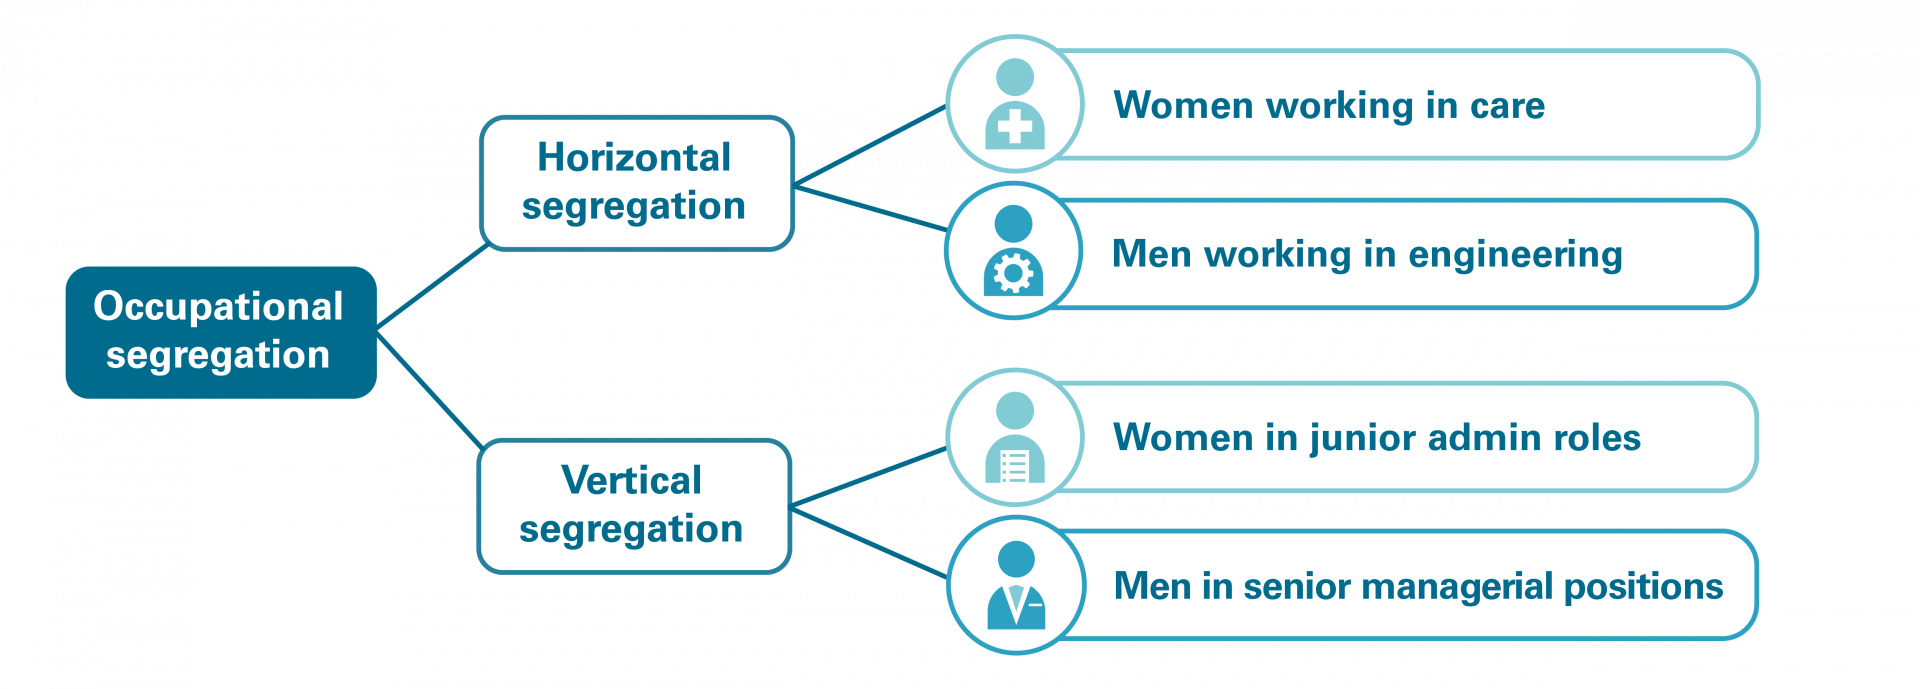
Occupational segregation is when women and men are concentrated into different types of work (horizontal segregation) and different levels of work (vertical segregation). For example, women tend to be found in lower paid jobs such as in care, cleaning or admin roles and these jobs are also lower paid. It is one of the major causes of the gender pay gap.
What did we find?
In our sample group, we saw a marginal improvement in gender pay gap figures in 14 of the 20 public bodies compared to previous years. Within our sample NHS Education Scotland (NES) seemed to be improving particularly well. NES reduced their mean gender pay gap from 13% in 2019 to 7.28% in March 2020 (see the good practice example below). However, there is still a wide reported mean gender pay gap from 1.01% to 35.7%, with two bodies close to zero at just over 1% and a further three bodies at around 3%.
Our analysis suggests that not all public bodies are clear about how they should calculate and present gender pay gap data. We found inconsistencies in the gender pay gap information provided. Legislation states that information should be published in a way that is accessible to the public, but we found that it was sometimes difficult to locate. There was often a lack of detailed analysis or sufficient breakdown of data, making effective action planning to reduce the gender pay gap more difficult. Where bodies gave information on job types and grading this helped them with their action planning.
Key findings from our sample of public bodies:
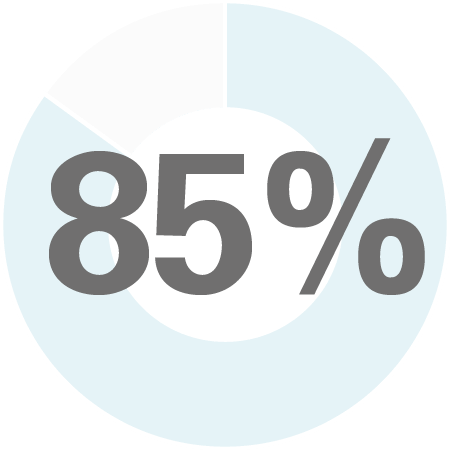 85 per cent published their overall mean gender pay gap figure for all staff, with 13 of the 20 providing both a mean and median figure in their latest report
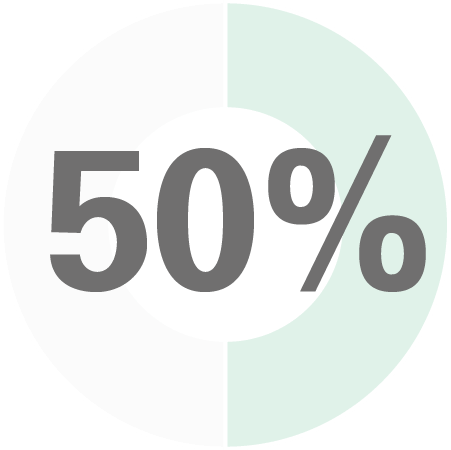 50 per cent provided some accompanying narrative or analysis of the gender pay gap figure
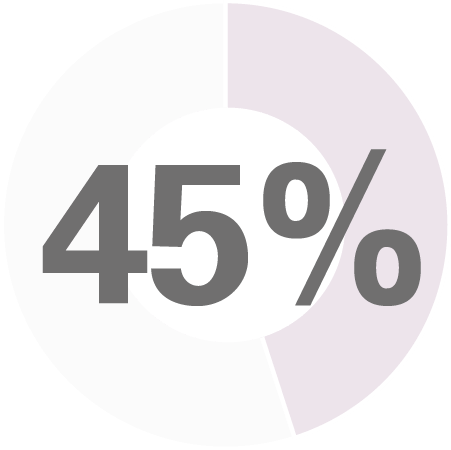 45 per cent gave information on job types and grading (sometimes known as occupational segregation)
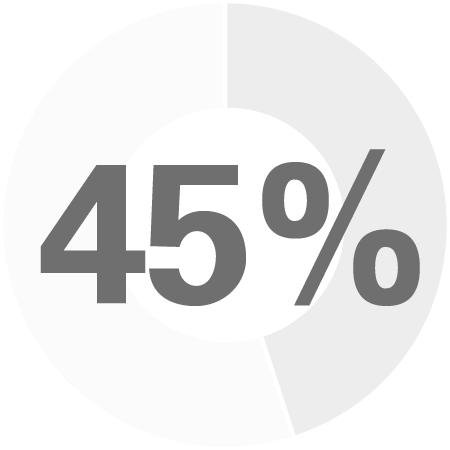 45 per cent showed some evidence of action planning
 15 per cent provided some additional data on gender and age, and gender and disability, which helps to identify if there are issues within specific sub-groups (intersectional data)
Good practice examples

Scottish Water
Scottish Water has a predominantly male workforce but has achieved a smaller mean gender pay gap than the national average. In 2021 it had a mean gender pay gap figure of 3.06%.
Scottish Water carried out detailed analysis and identified distribution of job types and grades as being the main cause of gender pay differences in their workforce. By carrying out further workforce and gender pay gap analysis by age as well as gender, length of service was recognised as having an impact on rates of pay.
Read more about Scottish Water
Since 2019, Scottish Water has taken several actions to address these issues, including:
- Creating education hubs to promote an interest in STEM related careers (science, technology, engineering and maths) from a young age
- Closely monitoring the number of female employees joining each year
- Introducing mentoring to provide extra support for female modern apprentices working in traditionally male roles
- Using recruitment campaigns in a gender sensitive way, for example featuring female modern apprentices in job adverts
- Establishing strong employee networks, including ‘Women in Scottish Water’, an employee led gender equality group
- Supporting flexible working practices where possible and winning the ‘Top 10 Flexible Employer in Scotland’ at the Flexibility Works Awards 2021.
Scottish Water’s focus on recruiting and developing women has led to a narrowing of the pay gap since 2019. It has also outlined further actions to increase diversity and inclusion in the organisation.
NHS Education Scotland (NES)
NHS Education Scotland (NES) had a mean gender pay gap of 7.28% in March 2020 (reduced significantly from 13% in 2019 and 19% in 2017). NES has a predominantly female workforce.
NES carried out detailed analysis of its pay gap figures within contract types and pay bands, showing some evidence of a concentration of women in certain job types and grades, and that a substantial proportion of women are working less than full-time.

Read more about NES
Since 2017 NES has taken steps to reduce its gender pay gap, including:
- Enhancing flexible working options and supporting a work/life balance
- Providing support for carers
- Using management and recruitment training to identify and remove unconscious bias and implementing a more values-based recruitment approach
- Improving retention, career development and progression through career advice, induction and returner programmes, flexible training, retainer schemes and support for performance
- Regularly reviewing workforce data and using qualitative feedback to develop insights into team and organisational culture, and staff experience.
 How can public bodies improve gender pay gap reporting?
To support transparency and public accountability public bodies should effectively use gender pay gap reporting to drive improvement. To enable them to do this public bodies need to improve their reporting by doing the following:
Publish both a mean and a median gender pay gap figure
The median is not skewed by very low or very high rates of pay. However, since gender pay gap issues are most pronounced in the lowest paid or highest paid employees the median may fail to pick up gendered differences as effectively as the mean figure. Publishing both figures is useful as it gives an additional perspective.
Publish the overall pay gap figure for the entire workforce
This should include full and part-time earnings and temporary employees as well as those on fixed-term contracts. This gives the most complete picture across the whole workforce of any gender pay inequalities.
Look at gender alongside other characteristics
Take an intersectional approach, for example break down gender data by age, ethnicity, and disability. Combining gender data with other protected characteristics highlights the further challenges faced by minority groups as these overlap and create different experiences of inequality.
Break down the data in different ways
This could include looking at the part-time pay gap figures and by grade and department. Also doing a comparison of full-time and part-time figures to encourage fuller analysis. The part-time gender pay gap can highlight if women are concentrated in part-time, lower paid roles.
It is possible for organisations to have a low overall gender pay gap figure but for women to be clustered in lower grades and under-represented in senior positions, such as in the NHS and social care.
Develop an action plan
Clearly set out areas for improvement supported by a SMART action plan (specific, measurable, attainable, relevant and time-limited).
Further information on analysing gender pay gap figures and why it is important
More women than men work in part-time roles, with part-time work often lower paid with fewer opportunities for progression. This means the gender pay gap is more apparent when comparing women’s average hourly part-time wage versus men’s average hourly full-time wage.
This can be analysed further by breaking down the data by grade to identify where part-time posts are concentrated and opportunities for part-time staff to progress into other roles, for example through flexible working and better training opportunities.
Hybrid and flexible working practices may also benefit women by allowing them to work full-time when they were previously unable to do so. It will be important for public bodies to monitor the impact of Covid-19 on working patterns and the impact it has on the gender pay gap.
The gender pay gap varies significantly by age, with women over 40 and black and minority ethnic women seeing a widening pay gap. Looking at other characteristics alongside gender means issues within different groups of women can be identified and addressed that would otherwise not be apparent by looking at gender alone.
Public Sector Equality Duty (PSED)
The Equality Act 2010 (Specific Duties) (Scotland) Regulations 2012 sets out equality duties for the public sector in Scotland requiring them to:
- report on mainstreaming the equality duty
- publish equality outcomes and report progress
- assess and review policies and practices
- gather and use employee information
- use information on members or board members gathered by the Scottish Ministers
- publish gender pay gap information (where they have at least 20 employees)
- publish statements on equal pay (where they have at least 20 employees)
- consider award criteria and conditions in relation to public procurement
- publish in a way that is accessible.
The Equality and Human Rights Commission (EHRC) is an independent statutory regulator established by the Equality Act 2006 and is responsible for enforcing the Equality Act 2010. It has published guidance explaining what public authorities need to do to meet the requirements of the general equality duty and the specific duties.
The Scottish Government is reviewing the PSED and carried out a consultation in early 2022. A summary of consultation responses and proposals for improvements were published in December 2022. A common theme was a call for clear and comprehensive guidance for listed authorities. In relation to pay gap reporting, there is a proposal to extend this to include ethnicity and disability. The intention is that any regulatory changes will come into force in 2025.
Links to further information
- Gender Pay Gap Statistics Close the Gap Working Paper, March 2022
- Essential guide to the Public Sector Equality Duty Equality and Human Rights Commission, July 2016
- Technical Guidance to the Public Sector Equality Duty: Scotland Equality and Human Rights Commission, September 2016
- Public Sector Equality Duty: Guidance for reporting on gender and employment, equal pay, and occupational segregation Close the Gap, August 2016
- Gender pay gap in the UK: 2022 Office for National Statistics, October 2022
- Fair Work Action Plan Scottish Government, December 2022
- Public Sector Equality Duty - operation review: consultation analysis Scottish Government, December 2022
- Guidance for employers on taking an anti-racist approach to tackling women’s workplace inequality Close the Gap, December 2022


